

The notion of critical value has a unique place in the discipline of statistics. It is important for confidence intervals, hypothesis testing, and decision-making in a number of analytical and scientific domains. The concept of critical value plays an important role in data analysis and predicting useful insights.
A hypothesis test is performed by comparing a test statistic against a critical value. If the test statistic is higher than (more than) the critical threshold, the null hypothesis (which is represented by H0) is rejected. A test statistic’s sample distribution, such as the t-distribution or the normal distribution, yields a specific number known as the critical value, which is used to determine whether to accept or reject the null hypothesis (H0).
In this comprehensive discussion, we will discuss the topic of critical value in detail. We will explain how to determine the critical value for different distributions with the help of elaborating some examples to understand precisely.
Defining Critical Value in Statistics:
A critical value in statistics is used to find the edge at which a statistical hypothesis test will reject the null hypothesis. It is evaluated by the desired significance level,which indicates the probability of committing a Type I error (mistakenly rejecting an accurate null hypothesis).
To compute critical values, one uses the significance level, sometimes denoted as (alpha), which corresponds to the probability of making a Type I error, or mistakenly rejecting anauthentic (or valid) null hypothesis.
One-tailed and two-tailed tests:
Before going into a detailed discussion, it is essential to describe the concept of the two-tailed and one-tailed hypothesis tests.Two-tailed hypothesis tests are also referred to as non-directional and two-sided tests due to their ability to test for effects in both directions.
A two-tailed test partitions the significance threshold percentage between the two tails of the distribution.
Since you can only assess for effects in a particular direction, one-tailed hypothesis tests are often referred to as directional and single-sided tests. The entire significance level percentage falls into one tail of the distribution when a one-tailed test is conducted.
The critical value calculation formula is dependent upon the intended significance level (α) and the statistical distribution. Here are some usual distributions and the critical value calculations that follow along with them:
Z-Distribution:
The z-table or a calculator can be used to determine critical values for a standard normal distribution. With α/2 representing half of the significance level, the critical value is zα/2. For instance, the critical value would be b if α = 0.05 which is a typical choice.
When the data valueshavebeen distributed normally and the sample size is very large, the notion of z-critical value is employed. For means and quantities, it is frequently utilized.In this sort of distribution, firstly, we compute the (α) value and subtract it from 1 if there is a two-tailed test and subtract from 1/2=0.5 if it is a one-tailed test.
Afterward, we observe the table for the z value and insert the negative sign in the final answer if the test is left-tailed.
T-distribution:
The t-distribution is employed when working with limited sample numbers or when the population standard deviation is unknown. In this distribution, the critical value is determinedby employing the degrees of freedom (Df) and the significance level (α).
The t-critical values can be located with the use of statistical tables or software.It helps usto apprehend precisely whether the population mean and sample mean differ significantly from one another or not.In this distribution, compute the (α) value first and then Df = sample size – 1).
Observe the relevant t-distribution table and take the intersection value by matching the (α) value and Dfto determine the t critical value.
Chi-Square distribution:
The critical value of the chi-square test depends on both the number of degrees of freedom and the level of significance. The significance level is expressed in the formula as χ²α.In tests of independence and goodness-of-fit, the Chi-square critical value plays a key role. It elaborates on the extent to which particular variables are related.
In tests for quality of fit and independence, the Chi-square critical value is employed. It explains how well categorical variables are associated.Similarly, in this distribution, compute the (α) value first and then Df = sample size – 1).
Nowtake the intersection value by matching the (α) value and Df to determine the chi-square critical value by observing its table.
F-distribution:
Critical values depend on the degrees of freedom for the denominator and numerator as well as the significance level for the ANOVA and other F-tests. They are calculated using the F-distribution. Moreover, it also assists in regression analysis.
This type of critical value establishes whether the null hypothesis should be rejected or not in a variance-based hypothesis test.To compute the f-critical value, determine the (α) value first and then Df1 = (1stsample size – 1) say x and Df2 = (2nd sample size – 1) say y.
Now take the intersection value by matching the (x) value and (y) value to determine the f critical value by observing its table.
How to Determine the Critical Value?
Now we will address some examples to apprehend the concept of the critical value in more depth.
Example 1:
Find out the critical valueif significance level α = 0.08for a right-tailed z-test.
SOLUTION:
Step 1:Given data is:
α = 0.08
Step 2:First, we are to subtract the value of significance level or ɑ = 0.0793 from 0.5 because it is a one-tailed test as mentioned in the given problem.
0.5 – ɑ = 0.5 – 0.08 = 0.4207
Step 3:Now looking at the z distribution table, we will observe:

Step 4:By adding the intersection values.
z = 1.4 + 0.01 = 1.41 Ans.
Example 2:
Let us have a sample size of 6 data points. Determine the t critical value if we aspire to perform a one-tailed t-test at α = 0.05.
SOLUTION:
Step 1:Given data is:
α = 0.05 and the sample size (m) = 6
So, Df = (6-1) = 5
Step 2:Now looking at the t distribution table, we will observe:
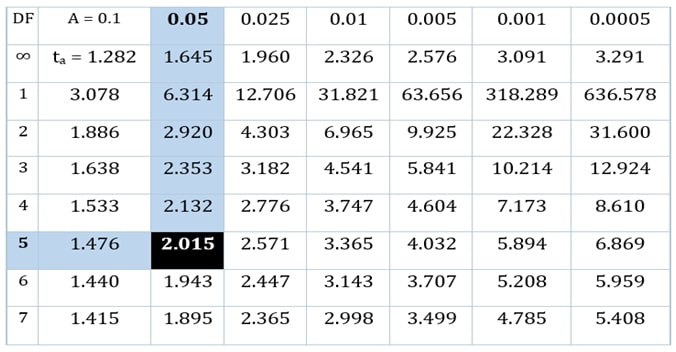
From the above table:
t (5, 0.05) = 2.015
Conclusion:
We have thoroughly examined the notion of the critical value in this entire conversation. We have covered the key kinds affecting the critical value in hypothesis testing in detail. We have talked about computing the z and t critical values for the one-tailed and two-tailed tests with examples. We hope that after reading this article, you will be able to solve the critical values for the z and t distributions problems with ease.